
1001 Bridgeway, #484,
Sausalito, CA 94965 USA
Ein # 87-2009546
Coastal Resilience
Mapping Tool

Image: Jason Doly
The Coastal Resilience Mapping Tool (CRMT) helps communities, decision-makers, and partners understand coastal risks and opportunities. Through interactive maps, you can explore sea level rise projections, flood risks, infrastructure vulnerabilities, and resilience resources in your community.
The CRMT highlights not only where risks exist now and in the future, but also where gaps in funding and resources leave communities more exposed. By linking risk data with programs, funding opportunities, and resilience efforts, the tool points to pathways for action, making it easier to target investments and build a safer, more resilient coast.
Resilience Context Maps
What does resilience look like in your community?
Utilize the Resilience Context Maps to gain a deeper understanding of the potential challenges, vulnerabilities, and opportunites within your community.
Click on the map and toggle between map layers.
Click through our different maps
-
Where are risks concentrated, and where resources already exist?
-
Where are low-income households at risk from SLR?
-
Where would coastal flooding awareness increase resilience?
-
Where would open space preservation improve flood resilience?
-
Where would inland flooding awareness increase resilience?
-
Where would reducing impervious surfaces improve flood resilience?
Zoom in to see how sea level rise and flooding could affect your community and nearby critical infrastructure, such as ports. Compare these future vulnerabilities with areas where resilience funding is already supporting initiatives like the Youth Climate Corps, Workforce Readiness Programs, and Blue Economy projects.


Resource Directory
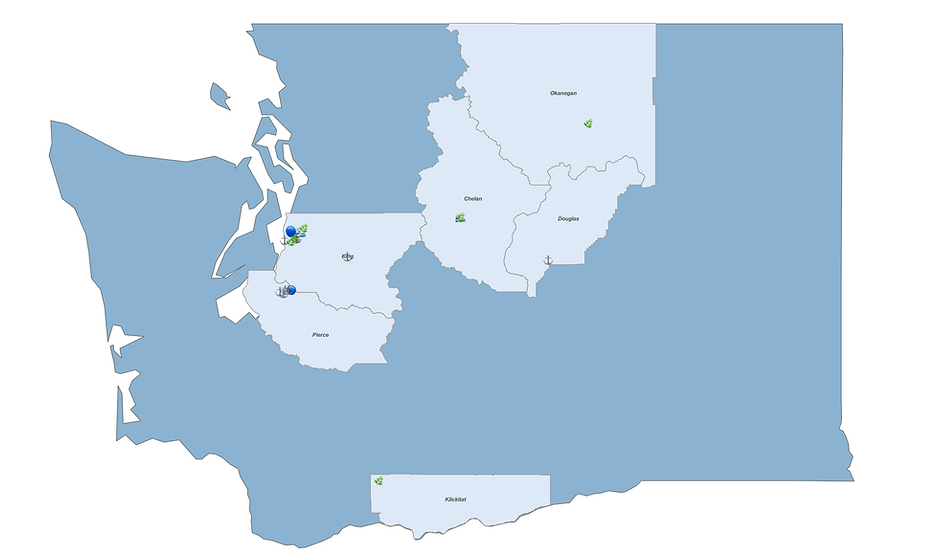
The Resource Directory is a regional, map-based guide to the people and programs advancing coastal resilience. Explore icons on the map to find local resources such as Workforce Readiness Programs, Youth Climate Corps, and Blue Economy initiatives. Each region includes a map view and a “directory book” that consolidates all resources into a table for easy reference.
Explore the Resource Directory to discover who is driving resilience work in your area and how you can connect.

Region 1: Puget Sound (Northern Washington)
Anchored by Seattle and Tacoma, this region forms the urban and ecological heart of the Puget Sound.
Image: Jessie Chou


Region 2: Columbia & Willamette Watersheds (Oregon)
Includes major urban centers and ecological zones from Portland down the Willamette Valley and out to the coast.
Image: David Gn Photography


Region 3: North Coast California
Comprising the more rugged, rural coastline from the Oregon border to the northern Bay Area fringe.
Image: Natasha Lèquepeys


Region 4: San Francisco Bay Area
A dense, urbanized coastal hub with strong port, cultural, and educational ties.
Image: Eric Ward


Region 5: Central & Southern California Coast
A broad region representing mid-to-south coastal California, emphasizing maritime, ecological, and urban coastal dynamics.
Image: Guillaume Merle


Best Practice Showcase
The Best Practices Showcase highlights inspiring, real-world examples of coastal resilience from around the globe. This curated collection showcases innovative, community-driven responses to sea level rise, flooding, and other climate-related challenges, complete with detailed descriptions, visuals, and links to relevant reports or toolkits.
Designed for planners, policymakers, educators, and advocates, the Showcase is meant to sparks ideas, fosters collaboration, and shares proven solutions to support local adaptation efforts. Explore what resilience looks like in action and let these global examples guide your community’s response.


